Back to the results guide

Body water: amount and distribution answer different questions

Litres describe how much water the body-composition model captured. Ratios instead describe where that water sits or what it is compared with. Similar-looking values can lead to different conclusions unless you identify both numerator and denominator.

Where to find it: The ECW Ratio Analysis and the separate Body Water result sheet.

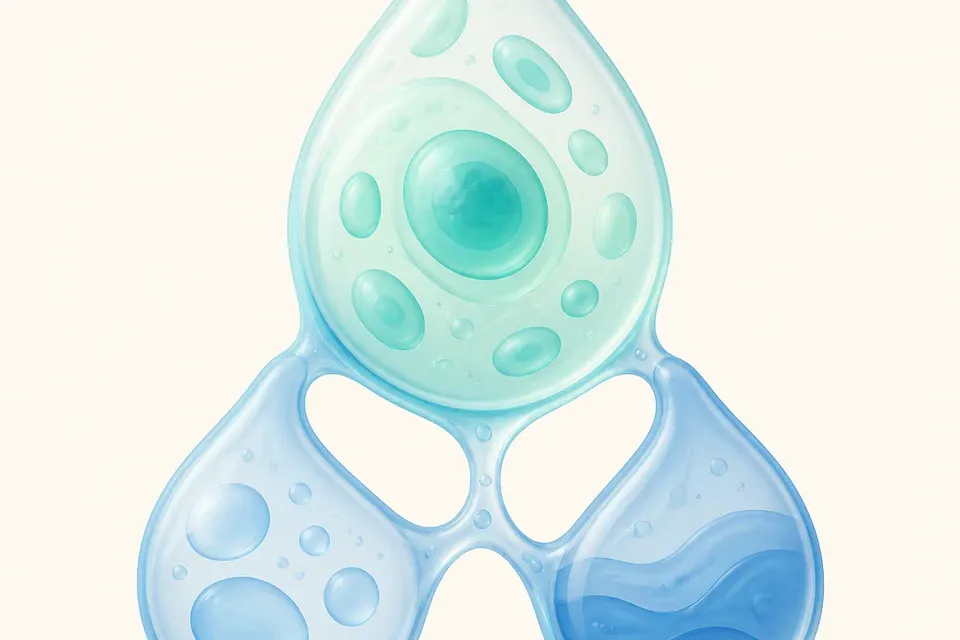
Illustration of water distributed between connected body compartments

01

How much water there is and where it sits

TBW, ICW and ECW are volumes in litres. ECW/TBW turns those volumes into information about their relative distribution.

Total body water (TBW) is the sum of intracellular water (ICW) and extracellular water (ECW). ICW is water inside cells, while ECW includes fluid between cells and water in blood plasma. These are connected parts of one model, not three independent measurements to be added together again.

Absolute water amount is strongly related to body size and the amount of fat-free tissue. Distribution answers a different question: how much of the total is inside cells and how much is outside. Two people can have different TBW in litres and the same ECW/TBW; the same amount of TBW can also be made up of a different ICW–ECW split.

  • TBW = ICW + ECW.
  • Litres describe absolute amount; ECW/TBW describes relative distribution.
  • Higher TBW alone does not mean better or worse hydration.
  • Read short-term changes cautiously because water also affects estimates of fat-free and muscle mass.

How much water there is

TBW

How water is distributed

ICWECW

ECW/TBW

Teaching diagram — these are not your measured data.

02

ECW/TBW describes a ratio, not its cause

The same ratio can arise in several ways: ECW can rise, ICW can fall, or both can change.

ECW/TBW divides extracellular water by total body water. It can therefore rise even when total litres of water barely change. To understand the movement, open ICW and ECW in litres as well and identify which component actually changed.

One number does not establish oedema, inflammation, dehydration or disease. Measurement conditions, time of day, recent activity, the amount of fat-free tissue and individual context can all matter. A trend measured under comparable conditions and read with related values is more useful than an isolated result.

  • ECW/TBW = extracellular water ÷ total body water.
  • Without ICW and ECW, a ratio change does not show which component moved.
  • A device reference band is neither a diagnosis nor an explanation of cause.
  • For an unexpected result, first check the measurement conditions and a repeat measurement.

03

Water percentage depends on the denominator

TBW/WT and TBW/FFM use the same water in the numerator but a different denominator, so they answer different questions.

Water as a share of weight compares TBW with total body weight. It is therefore influenced by fat mass, which contains less water than fat-free tissues. A lower share does not necessarily mean that someone drank too little before the test; it may simply reflect different body composition.

Hydration of fat-free mass compares TBW only with FFM. It is a consistency relationship within the model of fat-free tissues, not a personal drinking target. When weight or fat changes, the two percentages can move differently even though both use the same water amount.

  • TBW/WT: water as a share of total body weight.
  • TBW/FFM: water as a share of fat free mass.
  • A different denominator means a different interpretation.
  • Neither value alone tells a person how much to drink.

04

Segmental water shows whether a change is widespread or local

Five segments let you compare the right and left arms, trunk and both legs, but always in the context of segment size and its own ECW/TBW.

For each segment, the device reports total water and its intracellular and extracellular components. Do not compare absolute litres directly between an arm, the trunk and a leg: the segments differ in size. Compare right with left and follow the same segment over time instead.

Segmental ECW/TBW helps separate amount from distribution. More water with a similar ratio is a different pattern from an increase in the extracellular component without a matching ICW change. A local difference still does not identify a cause and should not be treated as a diagnosis.

  • Right and left are named from the measured person’s perspective.
  • Compare side with side and the same segment across visits.
  • Total segmental water and segmental ECW/TBW answer different questions.
  • More water can affect the estimate of segmental lean mass, so read the values together.

Verified sources for reading body water

The relationships between TBW, ICW, ECW and segmental water come from the InBody 970 interpretation manual. Peer-reviewed methodology sources add the necessary caution for interpreting one-off bioimpedance results.

Content reviewed · 2026-07-26

Explanations make the most sense alongside your own trend.

The public guide is open to everyone. The client portal adds your own value, history and the context of a specific measurement.