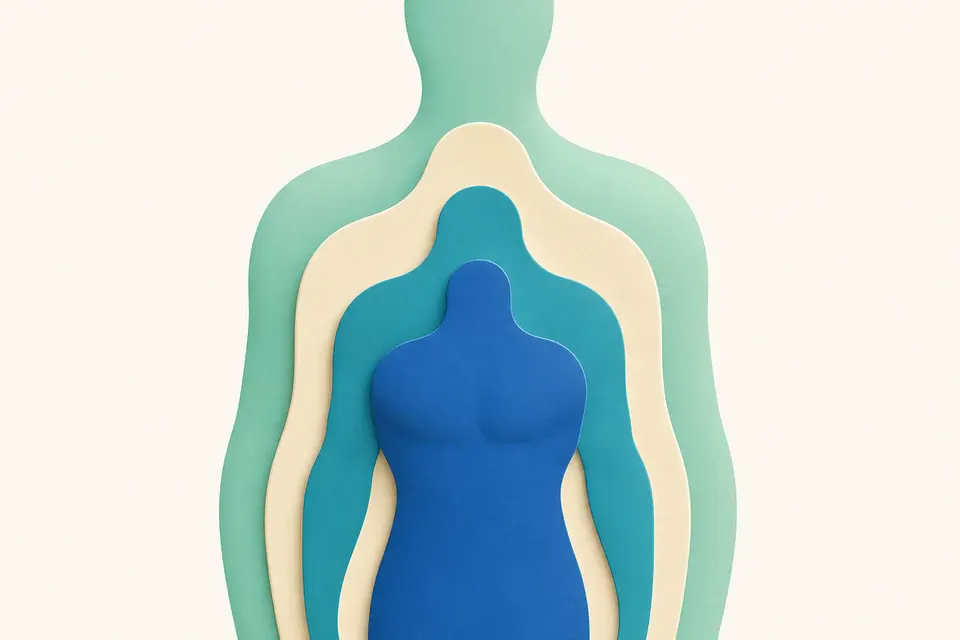
Body composition
What is my body weight made of?
The four basic components the body is made of: water, protein, minerals and fat. Most other values on the result sheet are derived from them.
12 valuesOpen this area →
Guide to the InBody result sheet
Clear and technically accurate explanations of muscle, fat, water, segments, phase angle and the other values on an InBody report.
Not sure where to start?
Choose what you are looking at. The guide will suggest two or three areas that make sense to read together.
Result areas
Each area opens an overview of the connections. The small links below it take you straight to an individual concept.
What is my body weight made of?
The four basic components the body is made of: water, protein, minerals and fat. Most other values on the result sheet are derived from them.
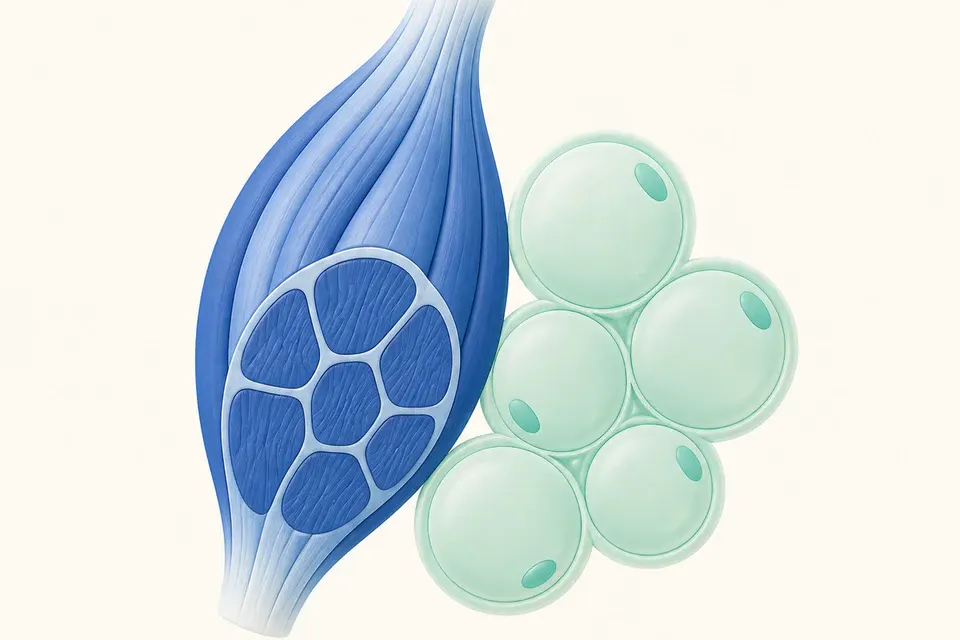
Is a weight change coming from muscle or fat?
The balance between muscle mass and fat, BMI, body fat percentage and the summary score. These values are related and should not be read in isolation.

How is water distributed inside and outside cells?
Total body water and how it splits between the inside and the outside of cells. Water is the component most affected by measurement conditions.
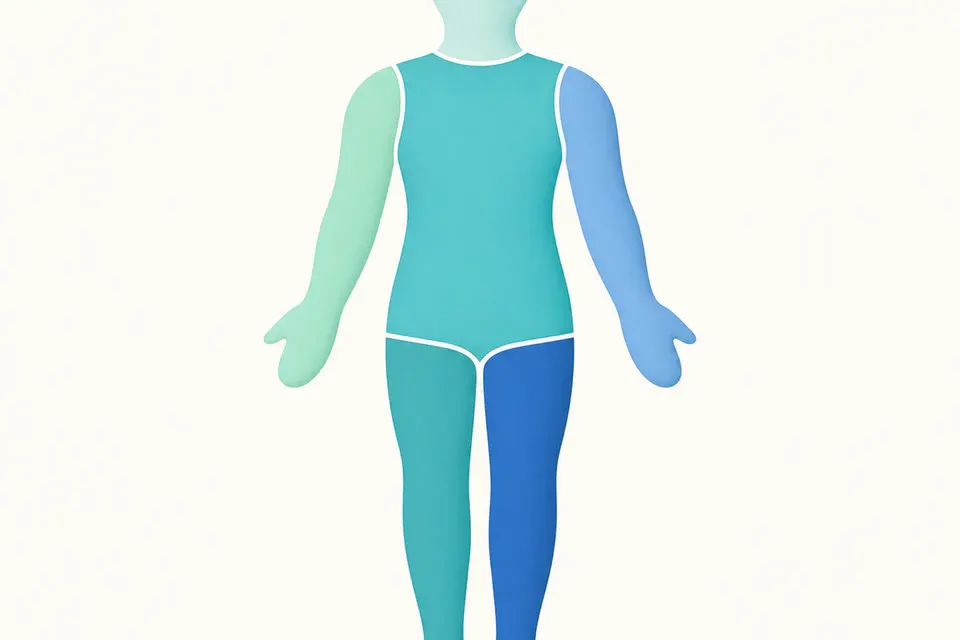
Do muscle, fat or water differ between body regions?
How muscle, fat and water are distributed across arms, trunk and legs. Sides are always given from the perspective of the person measured.
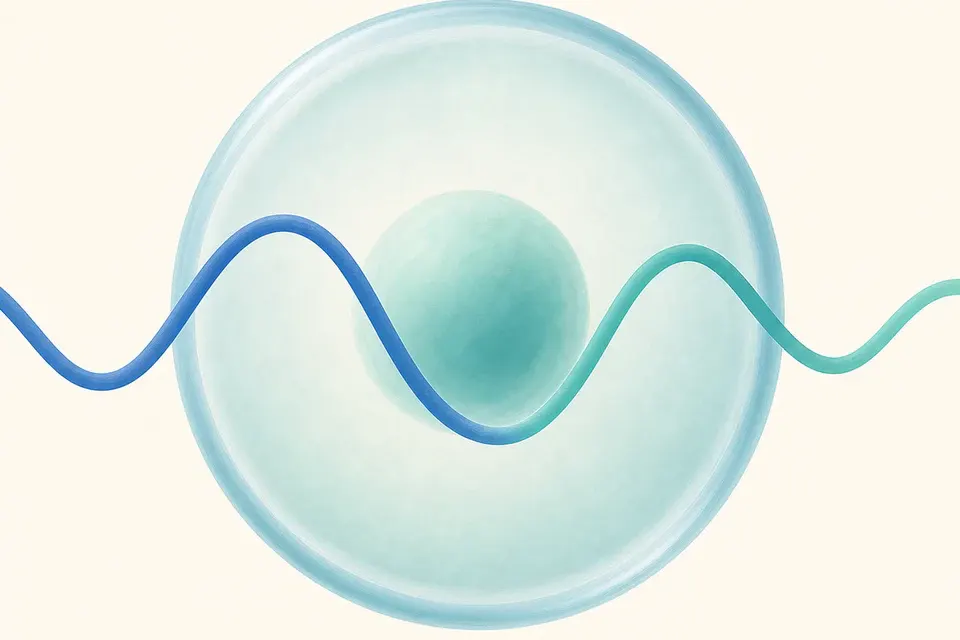
What does the electrical response of cells show, and why follow the trend?
An electrical property derived directly from the measurement. It is not a health grade but an indicator worth following over time.
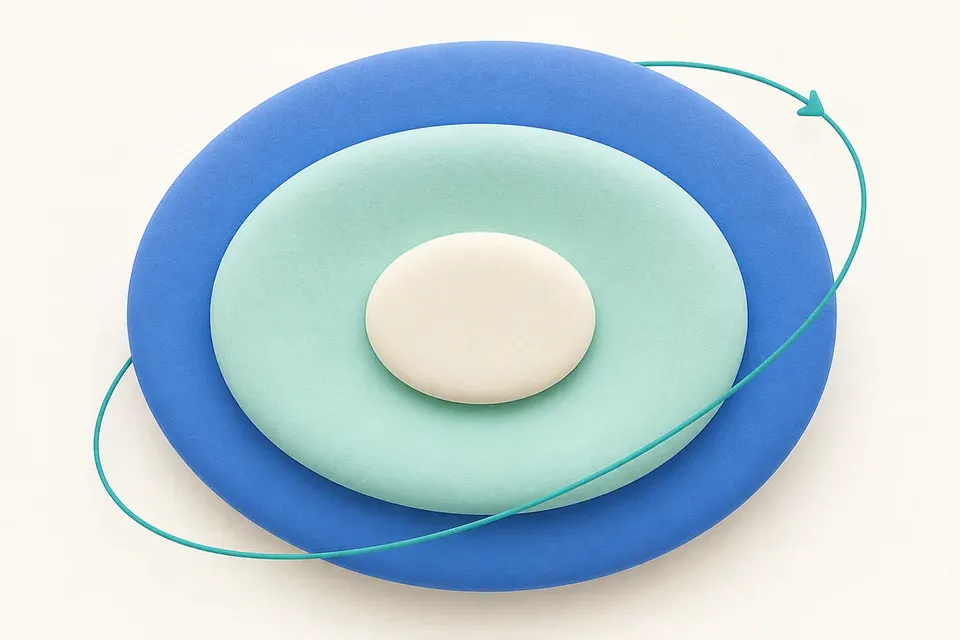
What is abdominal visceral fat, and how does it relate to energy expenditure?
Fat in the abdominal cavity, body circumferences and resting energy expenditure. These are the values most often confused with total body fat.
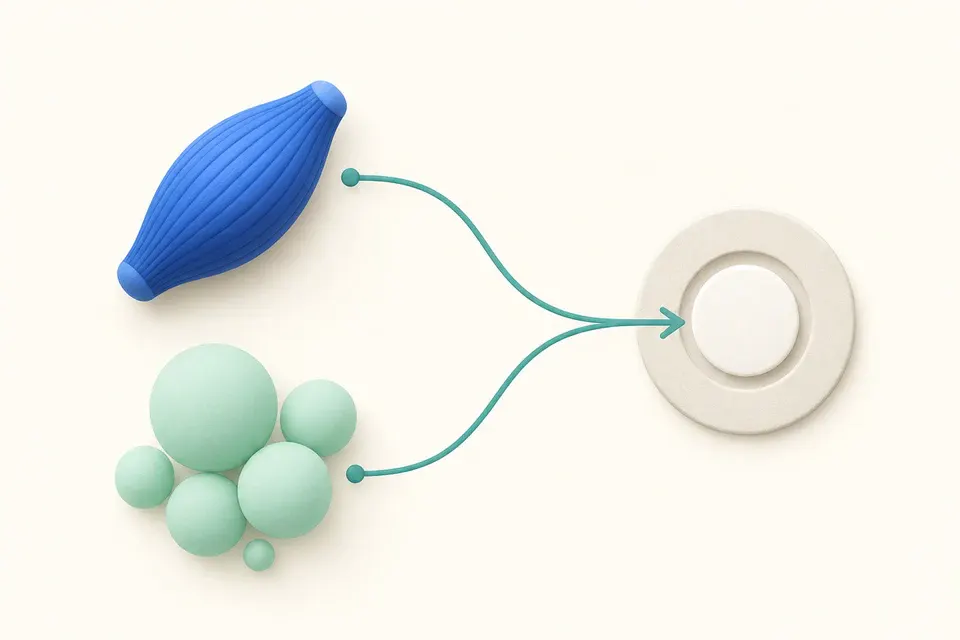
How should I read suggested changes in muscle, fat and weight?
Suggested adjustments to weight, fat and muscle. These are calculated from reference values, not a personal plan.
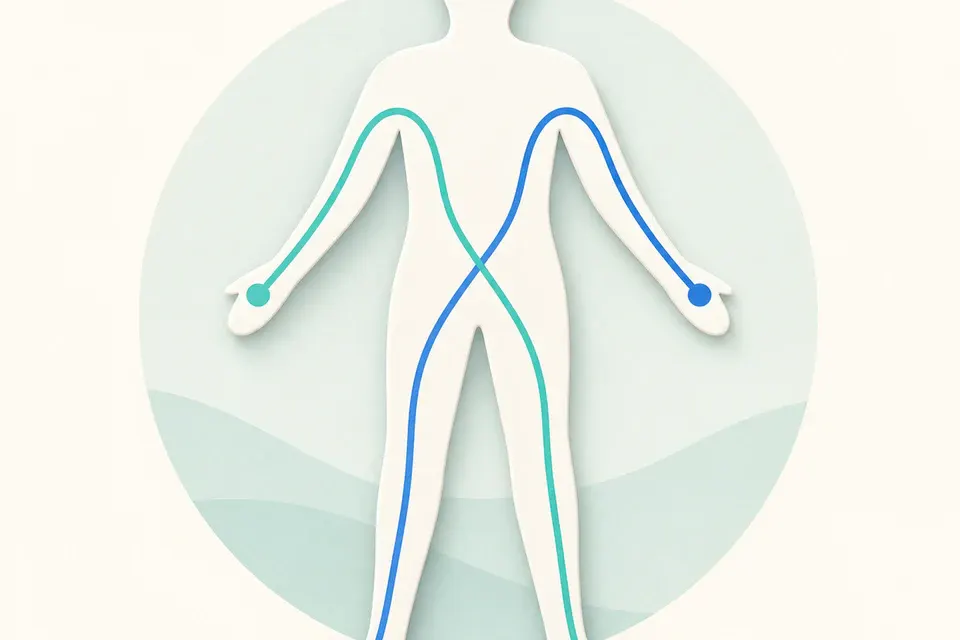
What does the device measure directly, and what does it estimate?
The raw electrical data the device derives everything else from. An explanation of how the measurement works and where its limits are.
Premium measurement
InGrip, BPBIO750 and MaxPulse add functional strength, blood pressure and pulse, vascular screening and short-term cardiac regulation to body-composition analysis. Each device uses its own method and has its own guide.
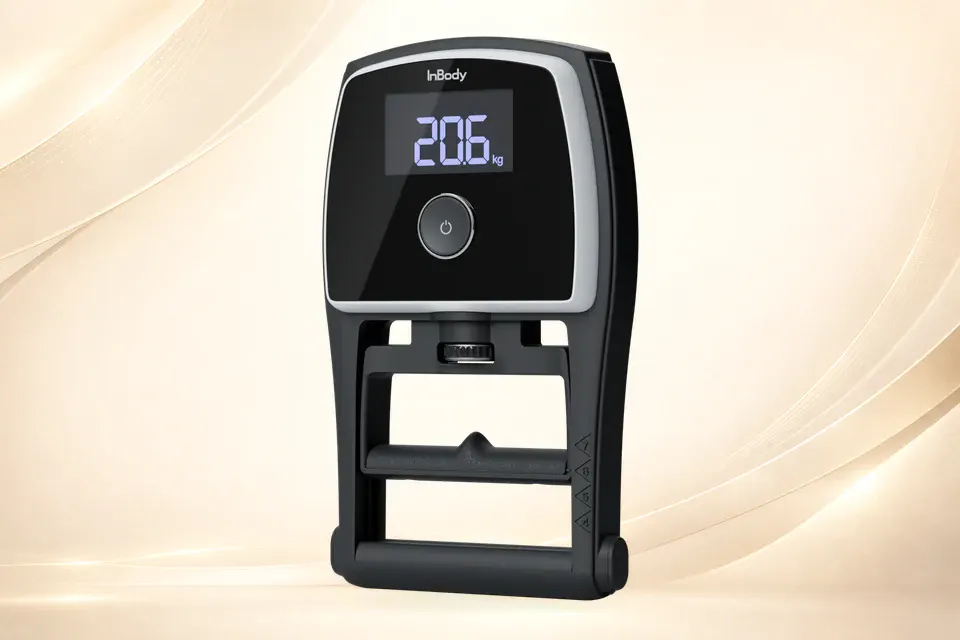
A detailed guide to InBody InGrip testing: attempts for both hands, best performance, asymmetry, HGS/WT, comparable trends and interpretation limits.
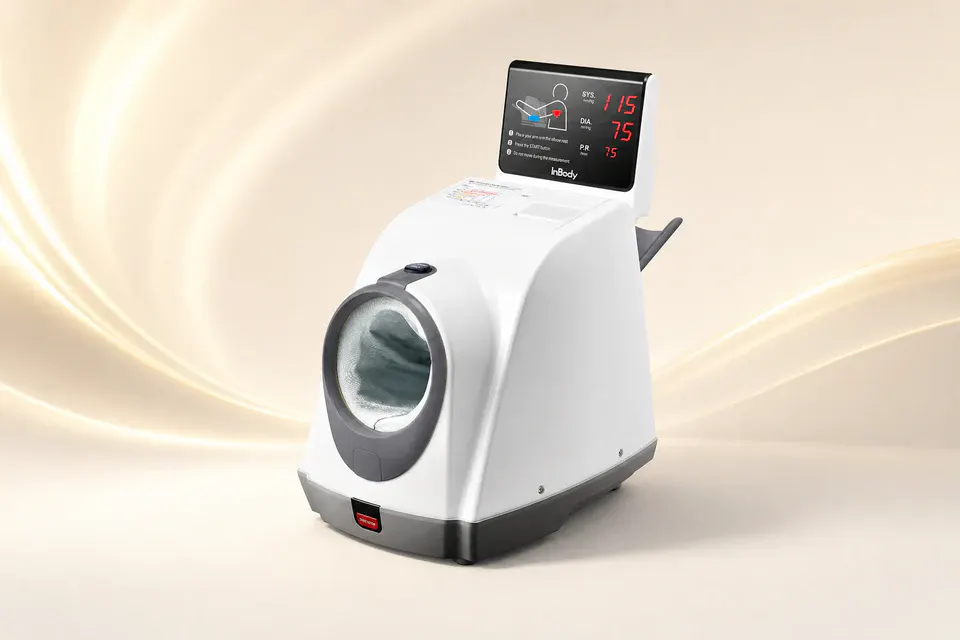
A detailed BPBIO750 guide: how oscillometric measurement works, how to read systolic, diastolic, pulse, MAP, PP and RPP, and why one reading is not a diagnosis.

A detailed guide to the MaxPulse vascular section: what finger PPG/APG captures, how to read vessel level, AE and PE, and where screening stops.

A detailed guide to the MaxPulse HRV section: heart rate versus variability, summary indices, measurement conditions and safe limits of interpretation.
Context first
The guide teaches you to read the value, the reference context and the trend separately, and only then together.
Reading methodology
When a difference between two results is a real change and when it is just noise: a checklist of comparable conditions, the inertia of each value and a sensible re-measurement interval.
From paper to concept
A reconstruction of the printed InBody 970S sheet with sample values. Click the box you have in front of you on paper to open the explanation of that value.
Commonly confused
The question "what is the actual difference between X and Y" gets its own page: a short answer, a side-by-side table and the situations where the two values part ways.
Index
The complete alphabetical list of terms this guide explains.
The public guide is open to everyone. The client portal adds your own value, history and the context of a specific measurement.