Back to the results guide

Muscle and fat: why body weight is not enough

One number cannot tell whether fat, muscle, water or their proportions changed. This guide combines the most useful values into one picture and shows how to read their shared trend.

Where to find it: The Muscle-Fat Analysis bar chart and the Obesity Analysis section that follows it.

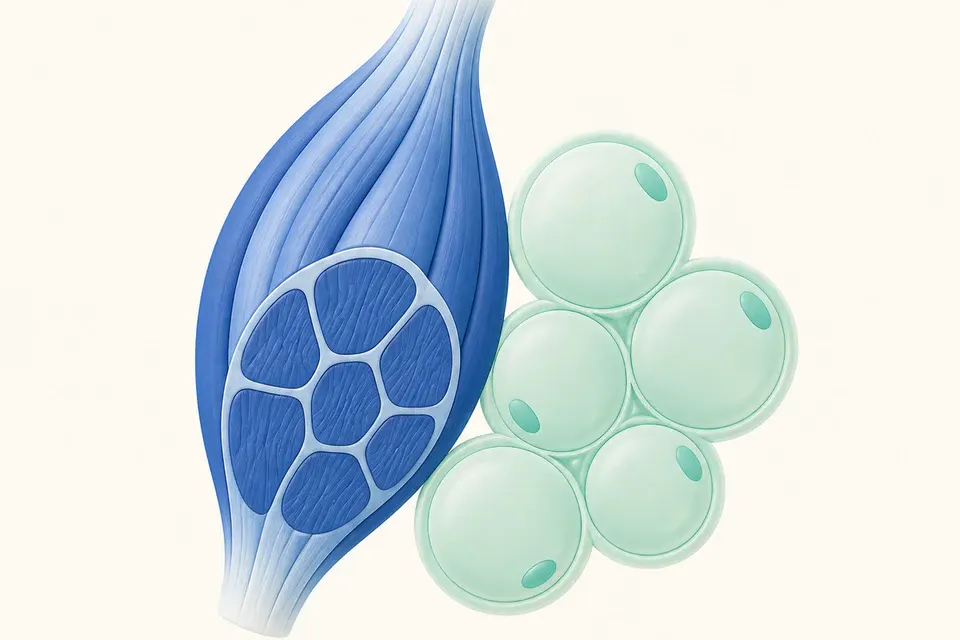
Illustration of muscle fibres and adipose tissue

01

Four numbers that belong together

Weight is the whole. Muscle and fat mass show what changes inside that whole, while percent body fat describes their proportion.

Weight is the only one of these four values that the device weighs directly. Skeletal muscle and body fat mass are estimated from bioimpedance, and percent body fat is then calculated as the share of fat mass in total weight. The same scale weight can therefore hide very different body composition.

For every comparison, ask three questions: did fat mass in kilograms change, did skeletal muscle mass hold or rise, and does percent body fat move consistently with them? Only the combined answer separates fat loss, body recomposition and loss of lean tissue.

  • Weight: the mass of the whole body, with no information about its composition.
  • Skeletal muscle mass (SMM): an estimate of muscle used for voluntary movement.
  • Body fat mass (BFM): an estimate of total fat mass in kilograms.
  • Percent body fat (PBF): the share of fat mass in current weight, not another quantity of fat.

02

SMM, SLM and FFM are not three kinds of muscle

They are nested model layers of the same body: skeletal muscle is the narrowest slice, soft lean mass is broader and fat free mass contains everything except fat.

Skeletal muscle mass (SMM) answers the everyday question “how much muscle do I have?” Soft lean mass (SLM) also includes other soft tissues and body water. Fat free mass (FFM) is broader still because it also includes bone minerals.

These values must not be added together. Changes in hydration can move SLM and FFM faster than actual muscle tissue, so a short-term difference should not be treated as certain muscle gain or loss.

  • SMM: the narrowest layer, focused on skeletal muscle.
  • SLM: soft lean mass without fat and without bone minerals.
  • FFM: everything except fat, including water, protein and minerals.
  • The same tissue appears inside several layers, so the values cannot be added.
Body weight
Fat mass
Fat-free mass

Muscle is only part of FFM

Teaching diagram — these are not your measured data.

03

The same weight change can mean a different outcome

The direction of weight is only the start. What matters is whether fat, muscle or both move with it.

During weight loss, the more useful pattern is falling fat mass while muscle mass remains approximately stable. During body recomposition, weight may stay flat because lost fat is balanced by gained muscle mass.

No single difference between two visits is a verdict. Hydration and test conditions affect bioimpedance estimates, so meaning comes from a repeated direction across several comparable visits.

  • Weight loss with lower fat and stable muscle is not the same as losing both fat and muscle.
  • Stable weight can hide simultaneous fat loss and muscle gain.
  • Weight gain is interpreted by checking whether muscle or fat accounts for most of the change.
  • Check a short fluctuation against water and test conditions; a longer trend carries more weight.
Fat decreasesFat increases
Muscle increasesRecompositionBoth components increaseMuscle decreasesBoth components decreaseShift towards fat
Teaching diagram — these are not your measured data.

04

Three visits are more useful than one difference

A time series helps separate a one-off fluctuation from a direction that repeats.

Compare tests performed under similar conditions and look for the same pattern to repeat. One unexpected visit between two stable results may reflect different hydration, food intake or recent exercise rather than a tissue change.

When reading the trend, start with fat and muscle mass in kilograms. Use percentages and summary scores only as supporting views because they depend on other values and can change even when the tissue of interest is stable.

  • Compare the same device and a similar time of day.
  • Look at the shared direction of fat, muscle, weight and water.
  • Do not explain a difference as tissue change if it does not persist at the next visit.
  • For a large or unexplained change, review test conditions and the wider health context.

Visit 1

82 kg

Visit 2

80 kg

Visit 3

80 kg

Teaching diagram — these are not your measured data.

05

Indices are cross-checks, not replacements for the core values

BMI, InBody Score, SMI, FFMI, FMI and muscle-to-weight ratio answer different questions. None describes body composition on its own.

BMI relates weight to height but does not separate muscle from fat. SMI, FFMI and FMI scale a selected component to height, making comparisons between people of different height easier. Muscle-to-weight ratio expresses proportion, not the absolute amount of muscle.

InBody Score is the manufacturer’s summary output for quick orientation. It is not a percentage, a diagnosis or a universal grade of health. Read secondary indices only after the core kilogram values and their trend.

  • BMI: a rough weight-to-height ratio that does not distinguish tissues.
  • SMI, FFMI and FMI: height-adjusted amounts of a selected component.
  • SMM-to-weight ratio: the relative share of muscle mass.
  • InBody Score: an algorithmic summary, not a standalone target.

Typical combinations of change

These teaching scenarios show relationships between values. They do not grade your individual result.

Mostly fat is being lost

Weight falls, fat mass falls and skeletal muscle mass remains stable across the trend.

  • Weight: decreases
  • Fat mass: decreases
  • Muscle mass: stays stable

This pattern is consistent with fat loss while preserving muscle mass; confirm it across comparable visits.

Weight is stable while composition improves

Fat loss is approximately balanced by muscle gain, so the scale can remain unchanged.

  • Weight: stays stable
  • Fat mass: decreases
  • Muscle mass: increases

Scale weight alone would hide this change. The combination of fat, muscle and the longer trend matters more.

Muscle mass falls with body weight

Weight and fat mass fall, but skeletal muscle mass moves in the same direction.

  • Weight: decreases
  • Fat mass: decreases
  • Muscle mass: decreases

Check whether the trend repeats and review test conditions; a one-off drop may also be related to hydration.

Weight is rising: muscle or fat?

Weight gain has a different meaning when muscle mass rises while fat mass remains stable.

  • Weight: increases
  • Muscle mass: increases
  • Fat mass: stays stable

If fat mass rises while muscle stays flat, it is a different pattern despite the same movement on the scale.

Verified sources for reading muscle and fat together

The structure is based on the InBody result-sheet manual and professional sources on the uses and limitations of bioelectrical impedance analysis. The scenarios are interpretation models for trends, not diagnoses.

Content reviewed · 2026-07-26

Explanations make the most sense alongside your own trend.

The public guide is open to everyone. The client portal adds your own value, history and the context of a specific measurement.