Back to the results guide

Body composition: the layers behind total body weight

The result sheet is not a list of independent numbers. Most values are different slices and sums of the same body components, so it matters to know which layer sits inside which.

Where to find it: The first table at the top of the result sheet, labelled Body Composition Analysis.

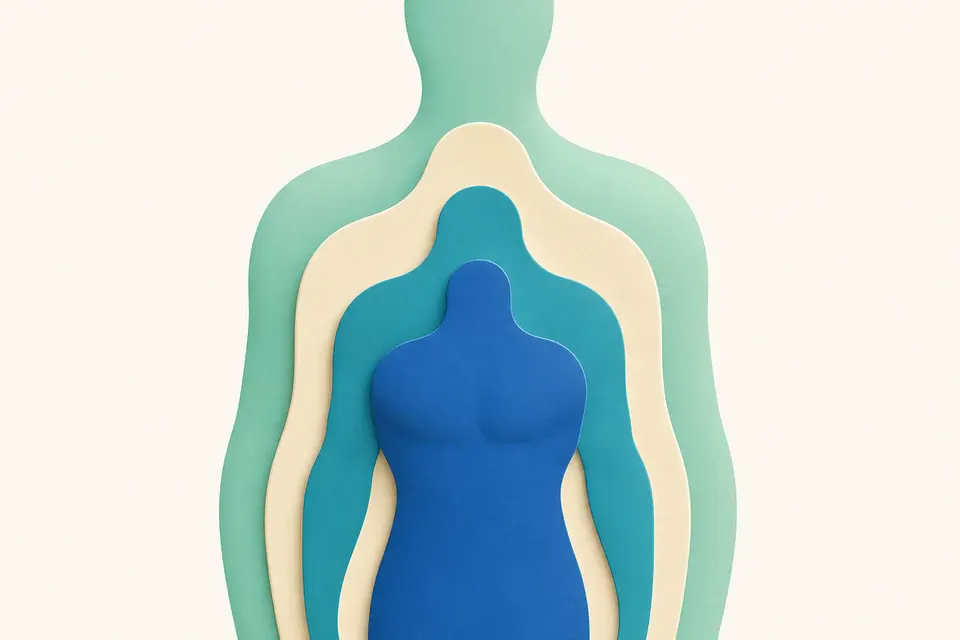
Illustration of the layers that make up body weight

01

Total weight is a sum, not an explanation

The same weight can be made up of different amounts of fat, water, protein and minerals.

At the highest level, weight can be split into fat mass and fat free mass. Fat free mass is not a synonym for muscle: it contains body water, protein and minerals, including bone minerals.

Two people with the same weight can therefore have very different body composition, and a change on the scale does not identify which component changed. This hub explains the static layer model; change scenarios belong in the related Muscle and fat guide.

  • Weight = fat mass + fat free mass.
  • Fat free mass contains water, protein and minerals.
  • Soft lean mass excludes bone minerals.
  • Skeletal muscle mass is a narrower estimate inside the soft tissues, not all fat free mass.
Body weight
Fat mass
Fat-free mass

Muscle is only part of FFM

Teaching diagram — these are not your measured data.

02

The four core components on the result sheet

Water, protein, minerals and fat form the model behind the broader totals on the sheet.

Total body water is the largest part of fat free mass. Protein represents the protein component of lean tissues, while minerals include both bone and non-bone mineral content. Fat mass sits alongside these three fat-free components.

The rows should not be treated as four independent results. A water change can affect the broader estimates of fat free and muscle mass, while fat is calculated within the model as the difference from total weight.

  • Total body water (TBW): water both inside and outside cells.
  • Protein: the modelled protein component of fat-free tissues.
  • Minerals: bone and non-bone mineral components.
  • Body fat mass (BFM): estimated fat in kilograms.

03

Why fat free, soft lean and muscle mass overlap

FFM, SLM and SMM are not separate items placed side by side; they are differently sized slices of the same model.

Fat free mass (FFM) contains everything except fat. Removing bone minerals produces soft lean mass (SLM). Skeletal muscle mass (SMM) is a narrower estimate of muscle used for voluntary movement; the manufacturer does not publish an equation that would let you calculate it from the other rows.

The practical consequence is simple: these values cannot be added or substituted for one another. To track muscle, start with SMM. For the broader fat-free component or calculations linked to it, use FFM and check body water alongside it.

  • FFM is the broadest fat-free layer and includes bone minerals.
  • SLM is FFM without bone minerals.
  • SMM is an estimate of skeletal muscle, not an algebraic remainder of SLM.
  • All three depend on a model derived from the bioimpedance measurement.

04

What the device measures directly and what it calculates

InBody directly measures weight and electrical impedance. Body components are modelled estimates linked to those measurements.

The electrodes record resistance and reactance in individual segments at multiple frequencies. From the electrical properties of tissues, the device estimates body water and the related fat-free components; fat mass is derived as the difference between weight and estimated fat free mass.

This does not make the results useless. It means they are most valuable when repeated on the same device under similar conditions. The absolute number is an estimate, while a consistent trend can be useful for tracking change.

  • Direct: weight, resistance and reactance.
  • Estimated: body water and the fat-free components derived from it.
  • Calculated: fat mass as the difference between weight and FFM.
  • For interpretation: comparable conditions and a trend matter more than a small one-off difference.

Verified sources for the body composition model

Relationships between components follow the InBody 970 interpretation manual. Professional sources on the principles and limitations of bioelectrical impedance analysis support the distinction between direct measurements and modelled estimates.

Content reviewed · 2026-07-26

Explanations make the most sense alongside your own trend.

The public guide is open to everyone. The client portal adds your own value, history and the context of a specific measurement.